12,400 miles of main. 1.8 million meters.
99.97% delivery reliability.
miles of distribution main
Spanning 14 counties and 3 service territories
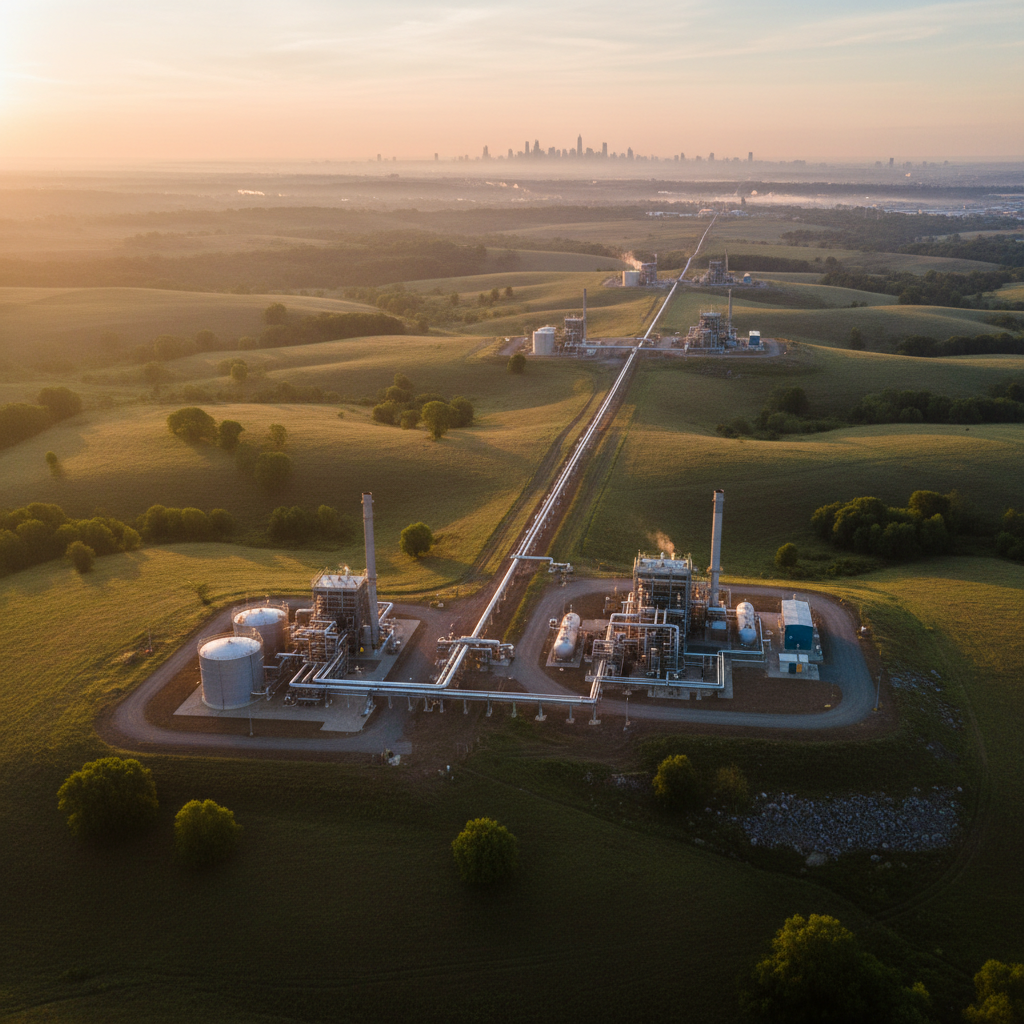
Infrastructure at a scale that reshapes geography.
From high-pressure transmission interconnects to the last quarter-mile of service line, Pipeline operates the largest gas distribution network in the region. 8,200 miles of steel pipe, 4,200 miles of polyethylene, and 47 compressor stations maintain pressure from wellhead to burner tip — continuously, across terrain that changes from open farmland to dense urban core.

Distribution corridor — Jefferson County service territory
A pressure reading that never moves.
Reliability isn't a metric we track — it's the operating standard every decision is made against. Redundant loop feeds, automated isolation valves, and a 24/7 SCADA control center ensure that when demand spikes at 5 a.m. on a January morning, every meter in the service territory stays at nominal pressure. The 0.03% variance represents planned maintenance windows, not failures.
Delivery reliability — 5-year trend
annual delivery reliability
Five-year average — exceeding all federal benchmarks
consecutive years without a major safety incident
PHMSA reportable incidents: 0 since 2014
Safety is not a program. It is the culture.
Eleven years without a PHMSA-reportable incident is the result of a systematic approach — not luck. Annual hydrostatic testing of high-consequence areas, cathodic protection monitoring on 100% of steel mains, and a leak survey program that covers every foot of pipe every three years. Our emergency response teams achieve sub-four-hour response on 96% of reported odor calls.
Safety & response performance — 2025
Download the System Reliability Report
Comprehensive operational data, capital investment summaries, safety performance metrics, and five-year infrastructure projections — compiled for municipal officials, developers, and facility managers.
Proactive investment before the regulator asks.
The most reliable system is the one that doesn't wait for failure. Pipeline's five-year capital plan prioritizes proactive main replacement, pressure regulation upgrades, and SCADA modernization — not reactive repair. Municipal partners and franchise authorities receive quarterly capital progress reports, with project-level transparency that supports long-range planning and rate case proceedings.

Main replacement — Downtown corridor, Phase III
capital invested 2020–2025
847 miles of main replaced — ahead of schedule
Infrastructure built to last. Commitments built to hold.
Sustained capital investment and operational discipline are the foundation of a utility that regulators, municipalities, and customers can depend on for the next century.
Capital invested 2020–2025
Pipeline replacement, corrosion protection, and SCADA modernization across the service territory.
Miles of aging steel replaced
Proactive main replacement program targeting pre-1970s infrastructure before regulatory deadlines.
Methane emissions reduction by 2030
Advanced leak detection, compressor electrification, and low-emission valve program underway.
Electronic AMR meter coverage
Automated meter reading across 1.8M residential and commercial meters as of December 2025.
Documents for every stakeholder.
Single-click access after completing the form above. All documents current as of Q1 2026.
Current Rate Schedules
Residential, commercial, and industrial tariff structures. Effective January 1, 2026.
PDF — 1.1 MB
All customers
Franchise Agreement Guide
Standard terms, right-of-way provisions, and negotiation framework for municipal planners.
PDF — 2.4 MB
Municipal officials
Developer Gas Service Application
Main extension requests, lot-ready service applications, and load-forecasting worksheets.
PDF + XLSX — 3.8 MB
Developers & builders
Industrial Load Management Guide
Curtailment protocols, interruptible service terms, and peak-shaving options for large-volume customers.
PDF — 1.7 MB
Facility managers
Emergency Preparedness Manual
Leak response procedures, 811 call-before-you-dig requirements, and emergency contact directory.
PDF — 0.9 MB
All stakeholders
Infrastructure Investment Plan
Five-year capital plan, pipeline modernization milestones, and emissions reduction targets.
PDF — 5.1 MB
Regulators & planners
All documents require one-time registration via the form above. For regulated tariff filings, visit the State Public Utilities Commission portal.